Valufact
AI-powered financial intelligence platform that transforms SEC filings into plain-English summaries, standardized financial data, and actionable insights for 11,000+ public companies.
Valufact turns SEC filings — the dense, 200-page legal documents that public companies are required to file — into plain-English summaries, standardized financial data, and actionable insights. Automatically, in minutes, for over 11,000 companies.
This is a solo, end-to-end personal project. I conceptualized, designed, engineered, and deployed every layer of the platform — from data pipelines and AI prompt architecture to the frontend experience and production infrastructure.
What did I do in this project?
- Identified the gap between institutional-grade financial data tools ($20K+/year) and what’s available to regular investors
- Designed and built the entire product from scratch as a solo developer — concept, architecture, UI/UX, backend, data pipelines, AI layer, and DevOps
- Engineered a real-time SEC monitoring system that detects new filings within minutes of publication
- Built a proprietary 6-phase document cleaning pipeline that transforms raw SEC filings (HTML, XBRL, SGML) into clean, structured text — achieving 60–85% file size reduction while preserving 100% of meaningful content
- Designed filing-type-specific AI prompt architectures with rigid JSON output schemas for consistent, structured analysis across 10-K, 10-Q, 8-K, Form 4, 20-F, and 6-K filings
- Developed a 4-layer financial concept classification engine mapping 17,738 GAAP concepts to standardized financial statement line items
- Built an 18-ratio financial analysis engine with data quality tracking, historical trend calculations, and plain-English explanations
- Processed and standardized financial data for 11,083 companies across 66,000+ fiscal periods
- Deployed and maintained the full production infrastructure including containerized services, distributed task queues, and background worker fleets
The Problem
Every quarter, thousands of publicly traded companies file detailed financial reports with the SEC. These filings are the single most authoritative source of truth about a company’s financial health — but almost no one can actually use them.
- They’re enormous. A typical 10-K filing runs 200+ pages of dense legal and financial text.
- They’re written in accounting jargon. The same metric might appear under 17,000+ different naming conventions across companies.
- They’re inconsistent. Apple’s balance sheet doesn’t look like Goldman Sachs’s — even though they report to the same regulator.
- There’s no standard summary. Making sense of raw filings requires financial expertise, context, and hours of time.
The tools that solve this — Bloomberg, Refinitiv, FactSet — cost $20,000–$25,000 per year. Valufact closes this gap.
AI-Powered Filing Analysis
When a company files a document with the SEC, Valufact’s backend detects it, downloads it, and runs it through a proprietary multi-stage processing pipeline. What comes out is a structured, human-readable analysis.
What Users See
Every filing is transformed into a set of structured, actionable views:
- ELI5 (Explain Like I’m 5) — A single, jargon-free sentence anyone can understand
- Key Takeaway — The single most important insight — the thing an analyst would tell their boss first
- TL;DR — Concise factual summary with the headline numbers
- Analyst Summary — Bullet-point insights extracted from the Management Discussion & Analysis section
- Opportunities & Risks — Identified opportunities and risk factors in plain language
- Potential Implications — Forward-looking analysis for company performance and stock price
- Filing Breakdown — Every major section summarized individually with expandable detail
Before & After: Raw SEC Filing → Valufact Summary
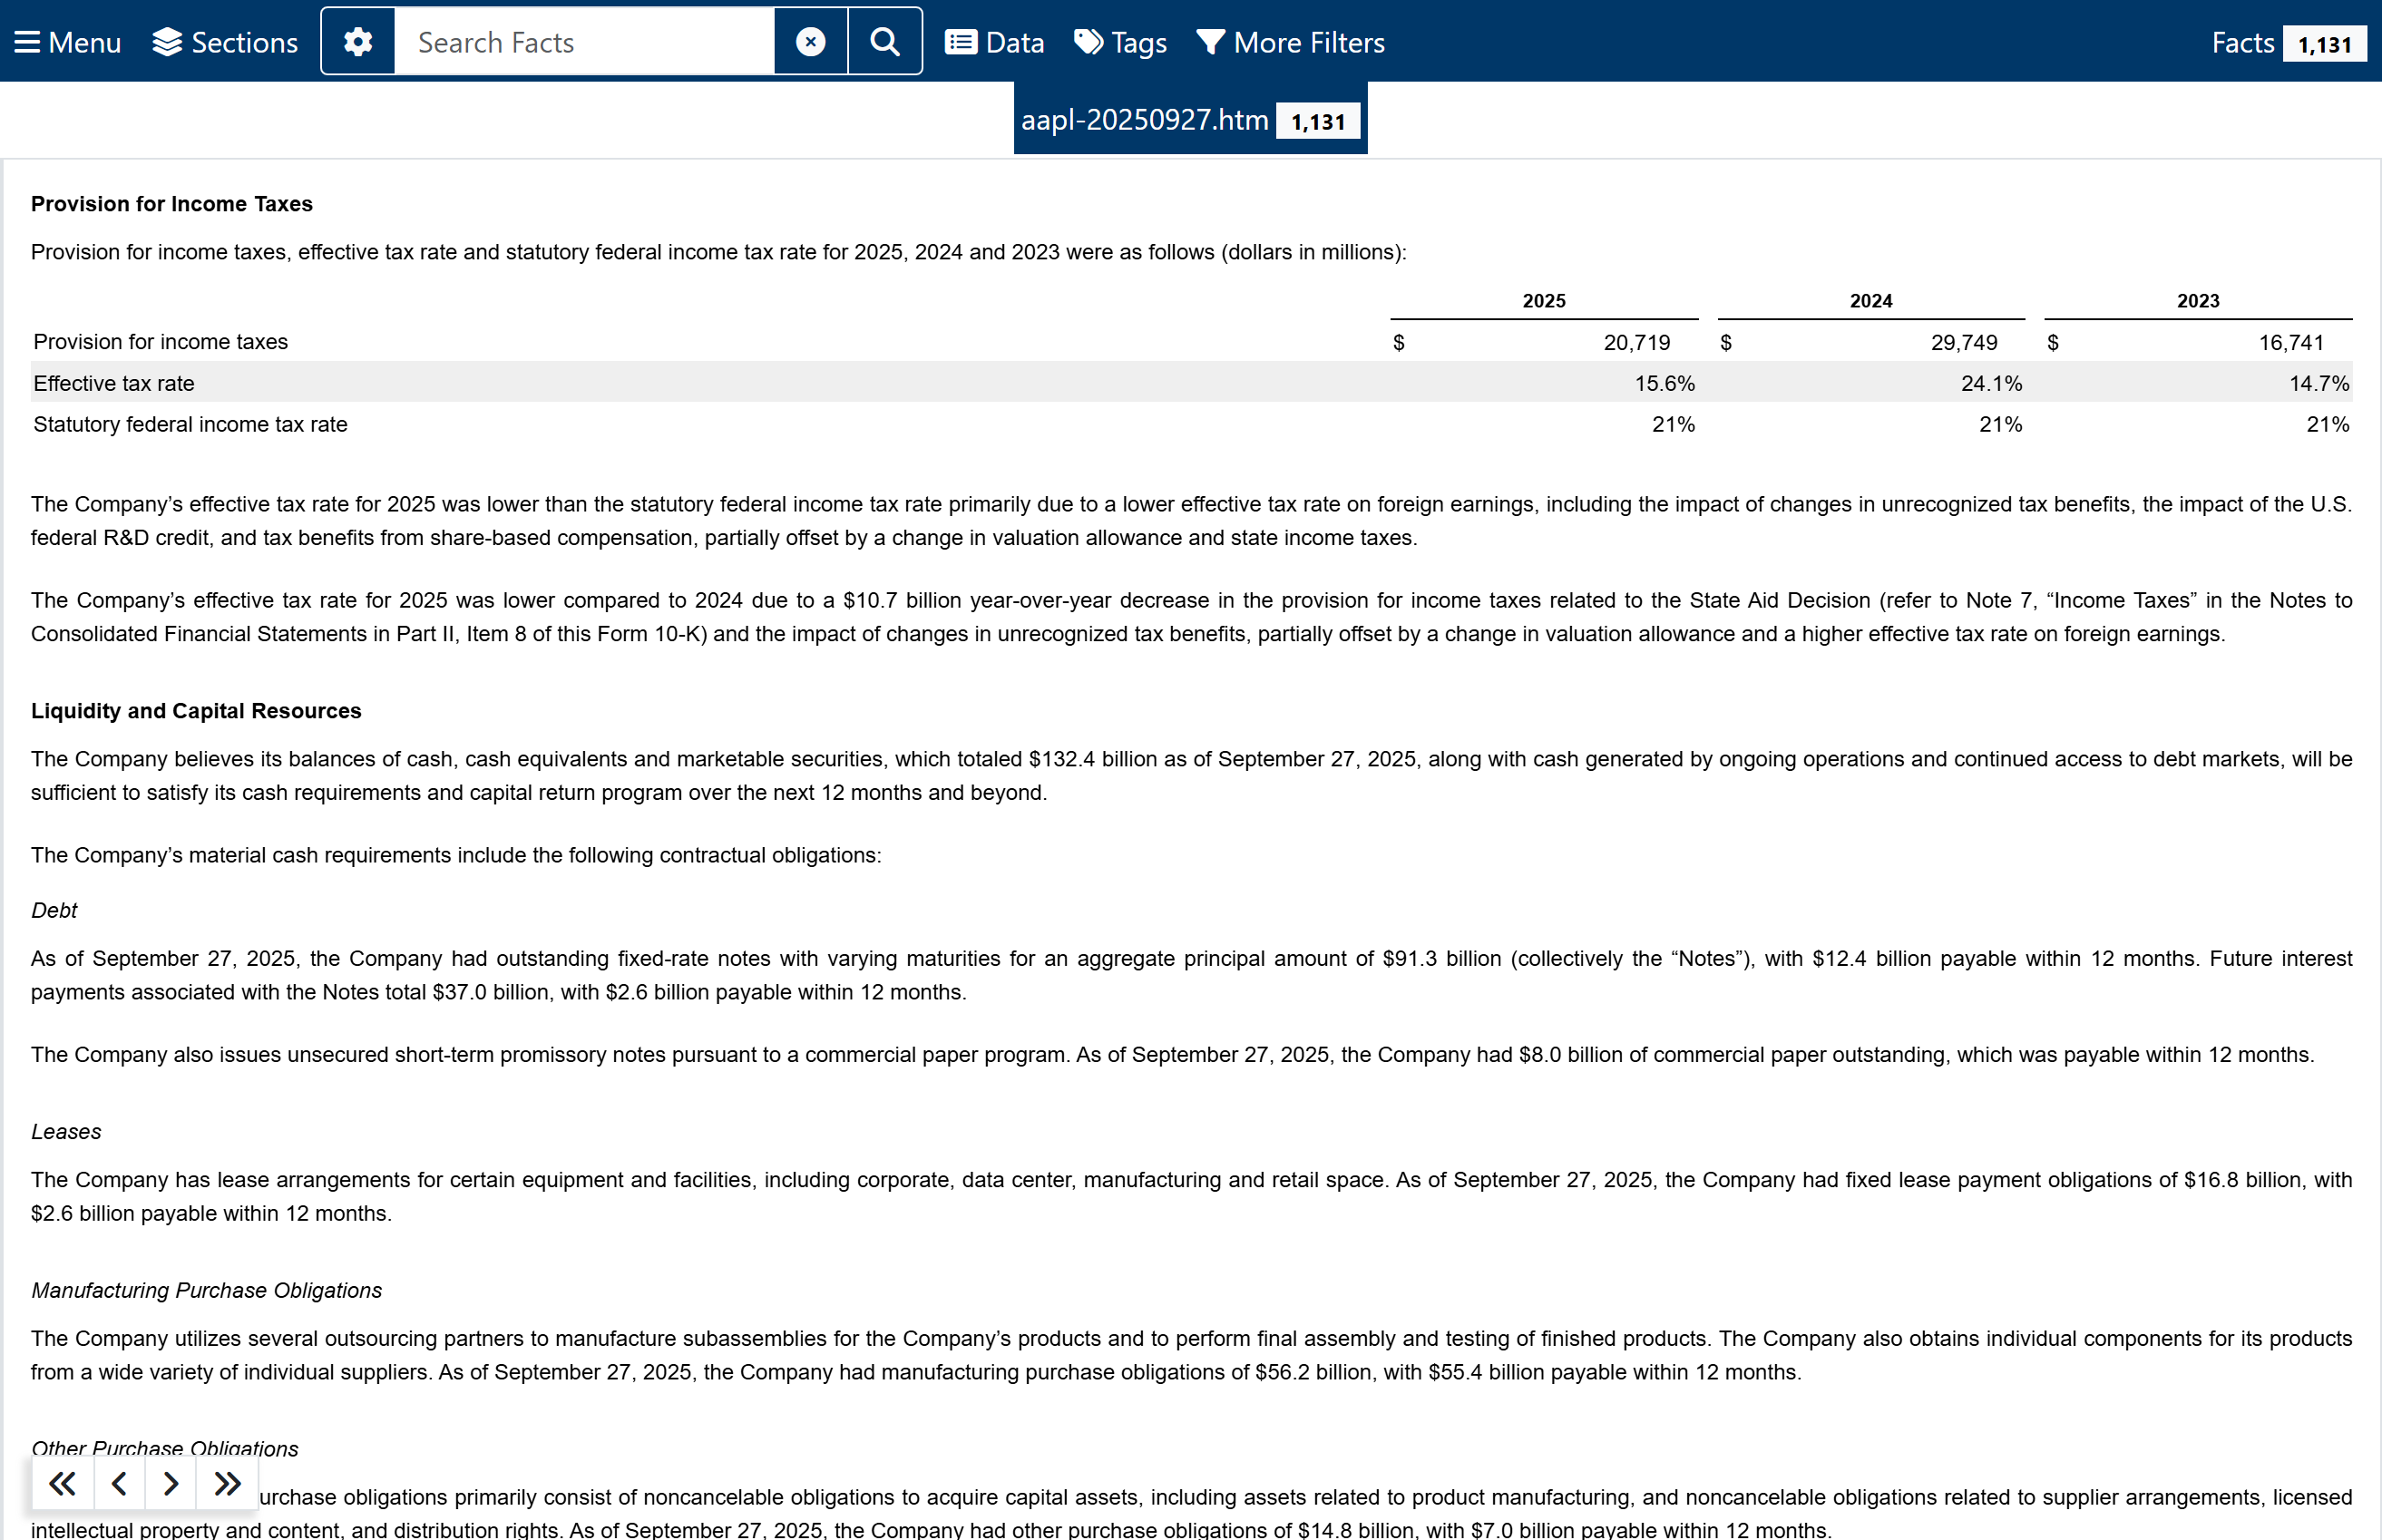
The raw SEC filing (left) vs. what Valufact produces (right) — the same document, transformed into structured, actionable intelligence.
Raw SEC Filing
Valufact Analysis
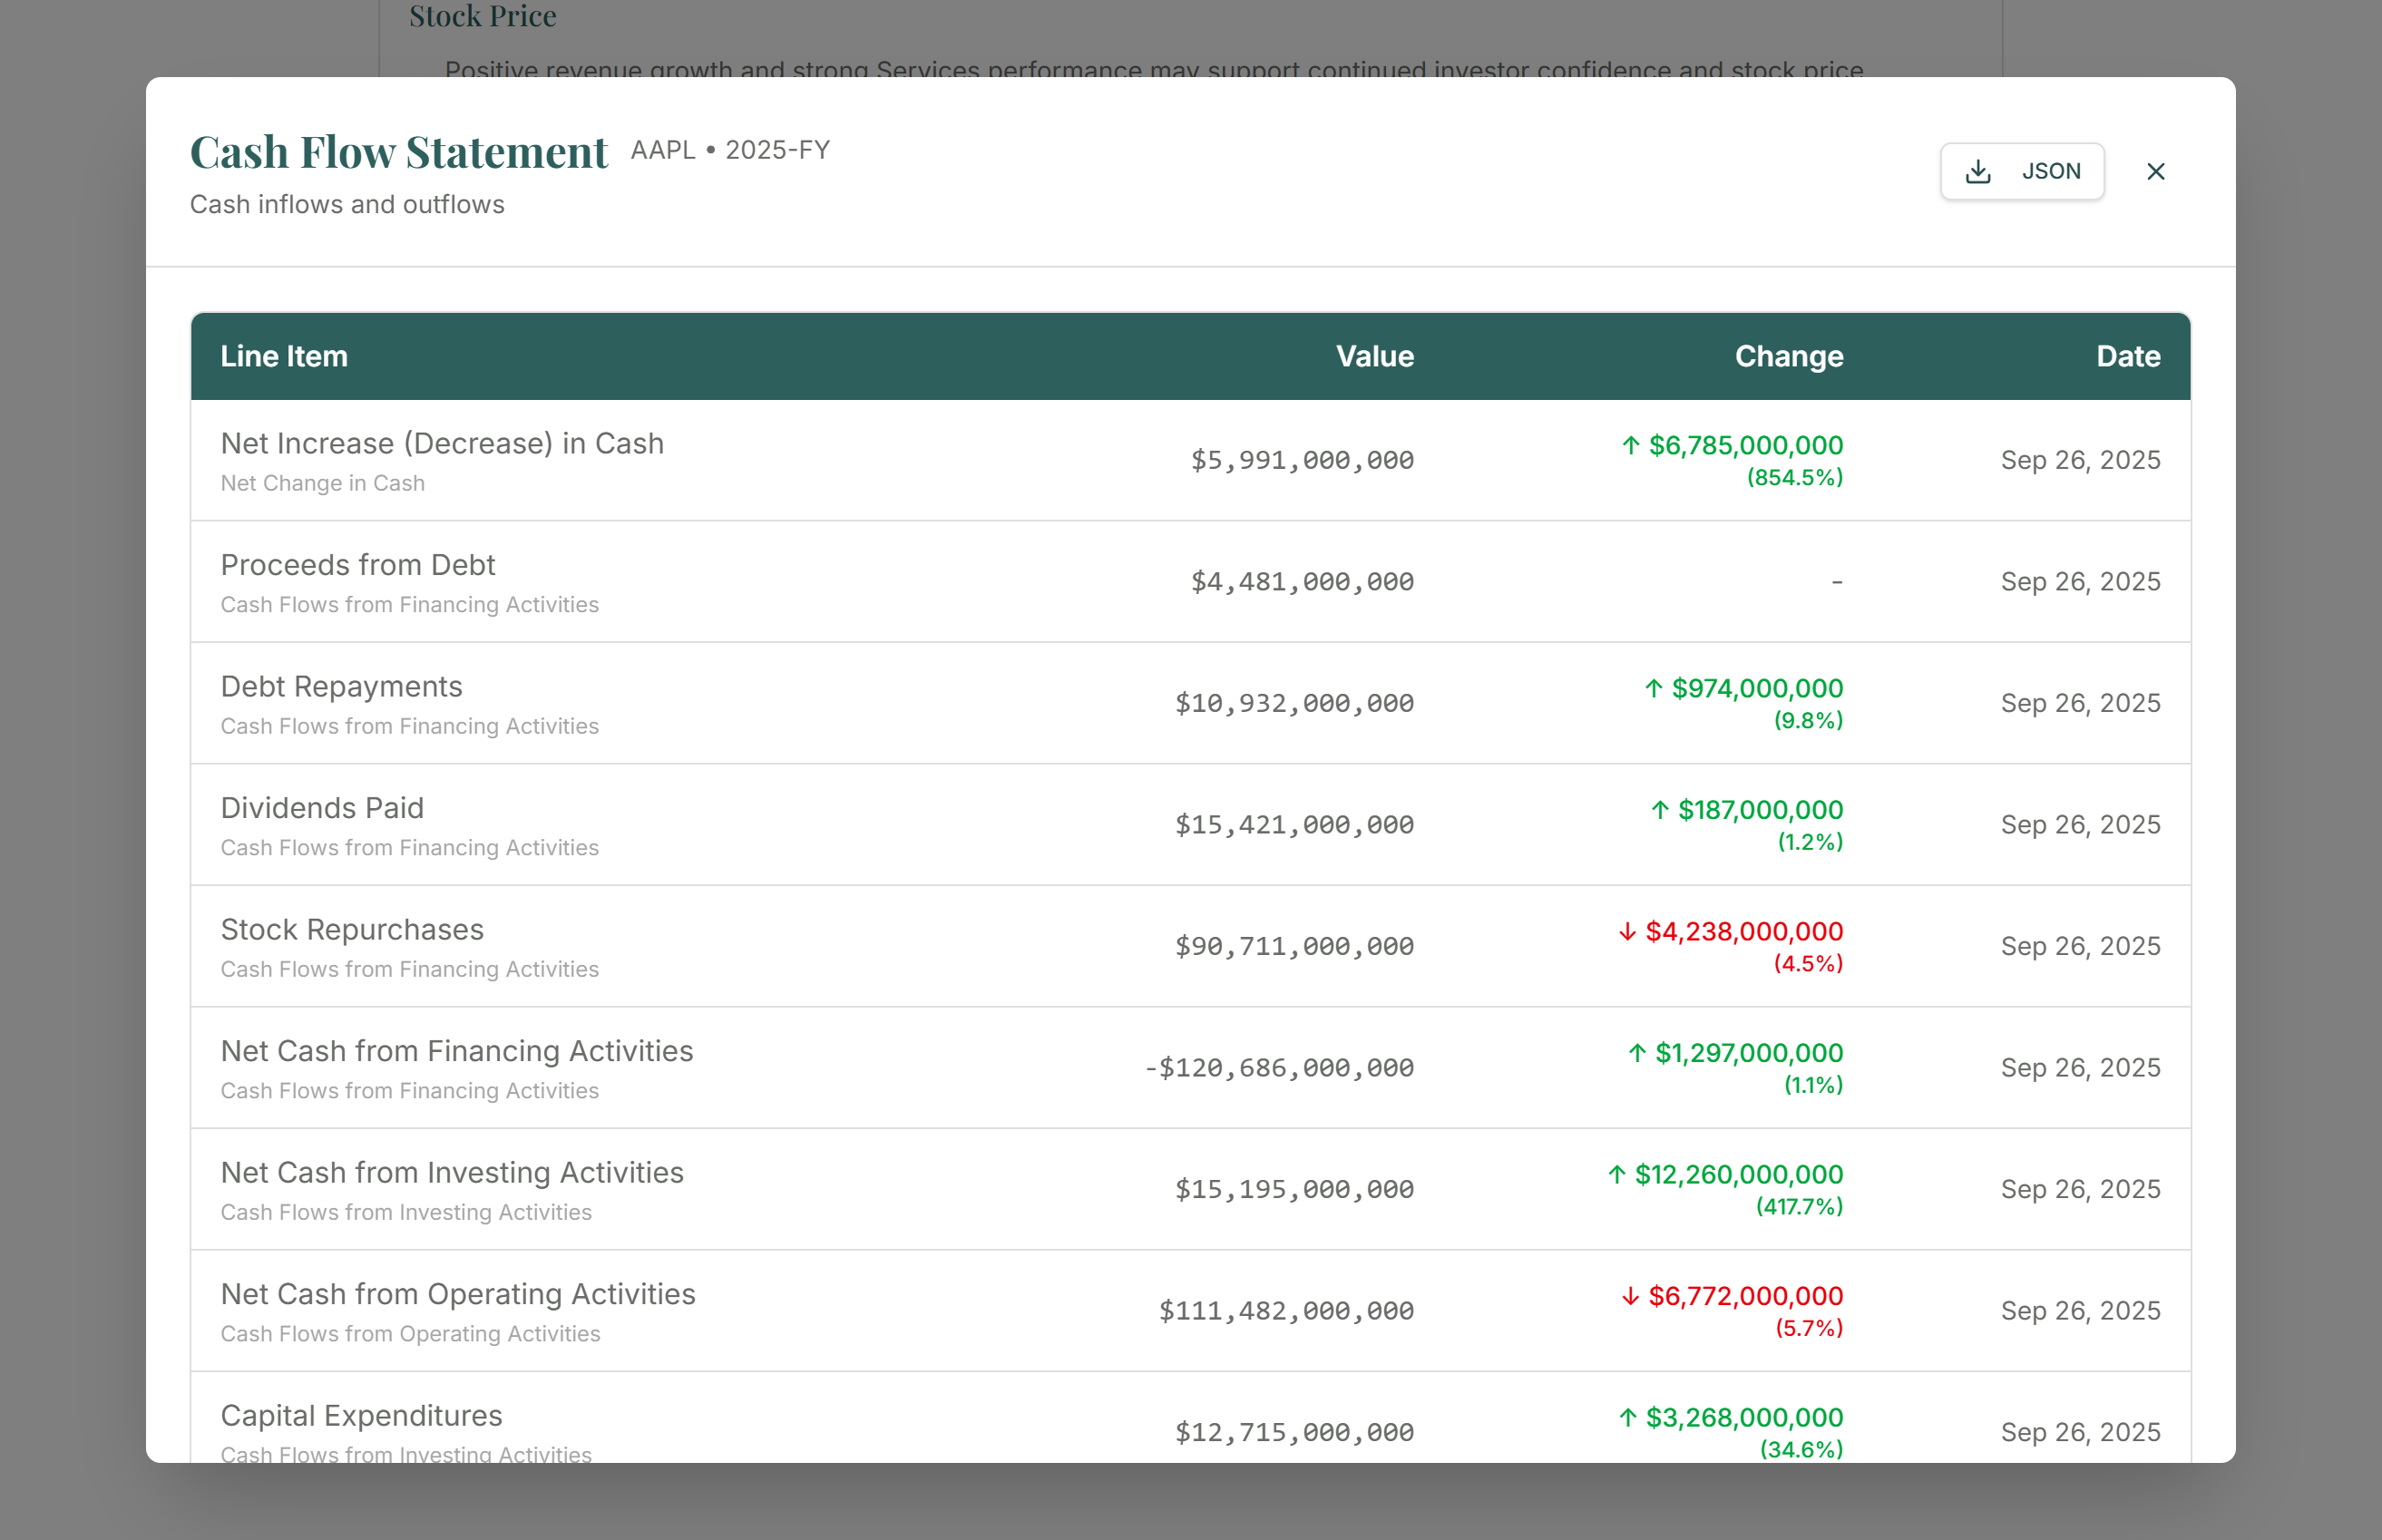
Before & After: Raw Financial Data → Standardized Statements
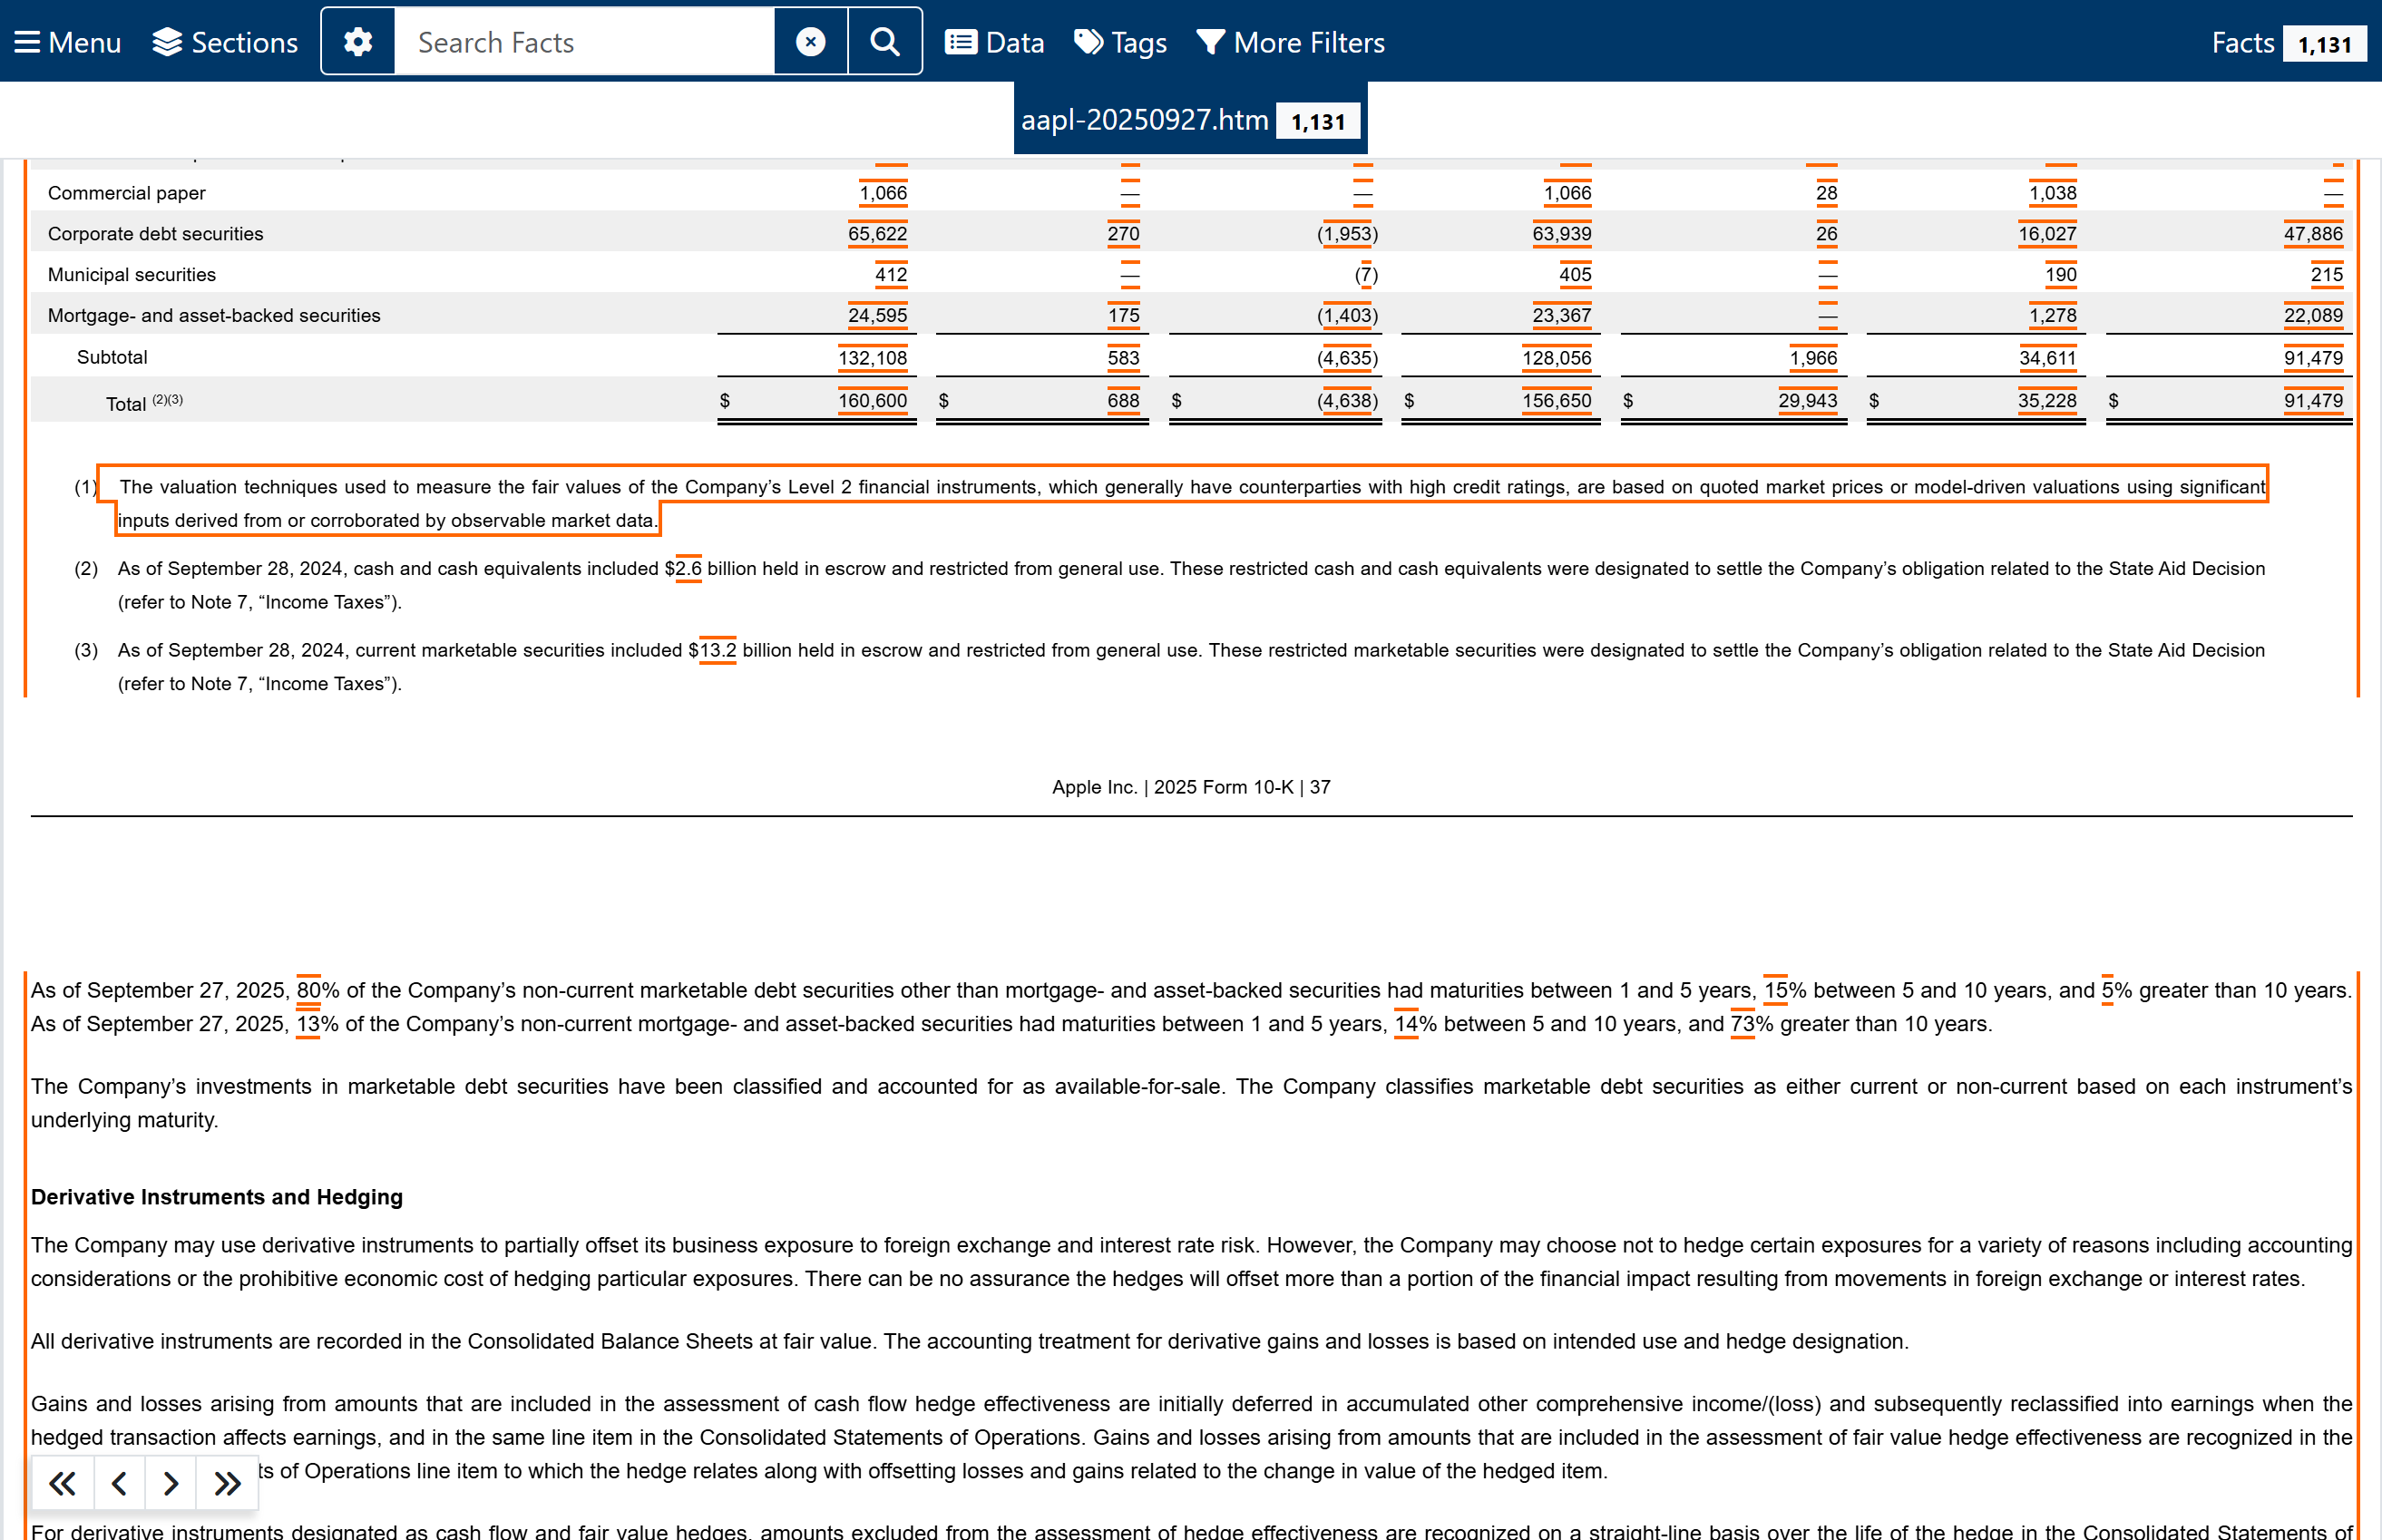
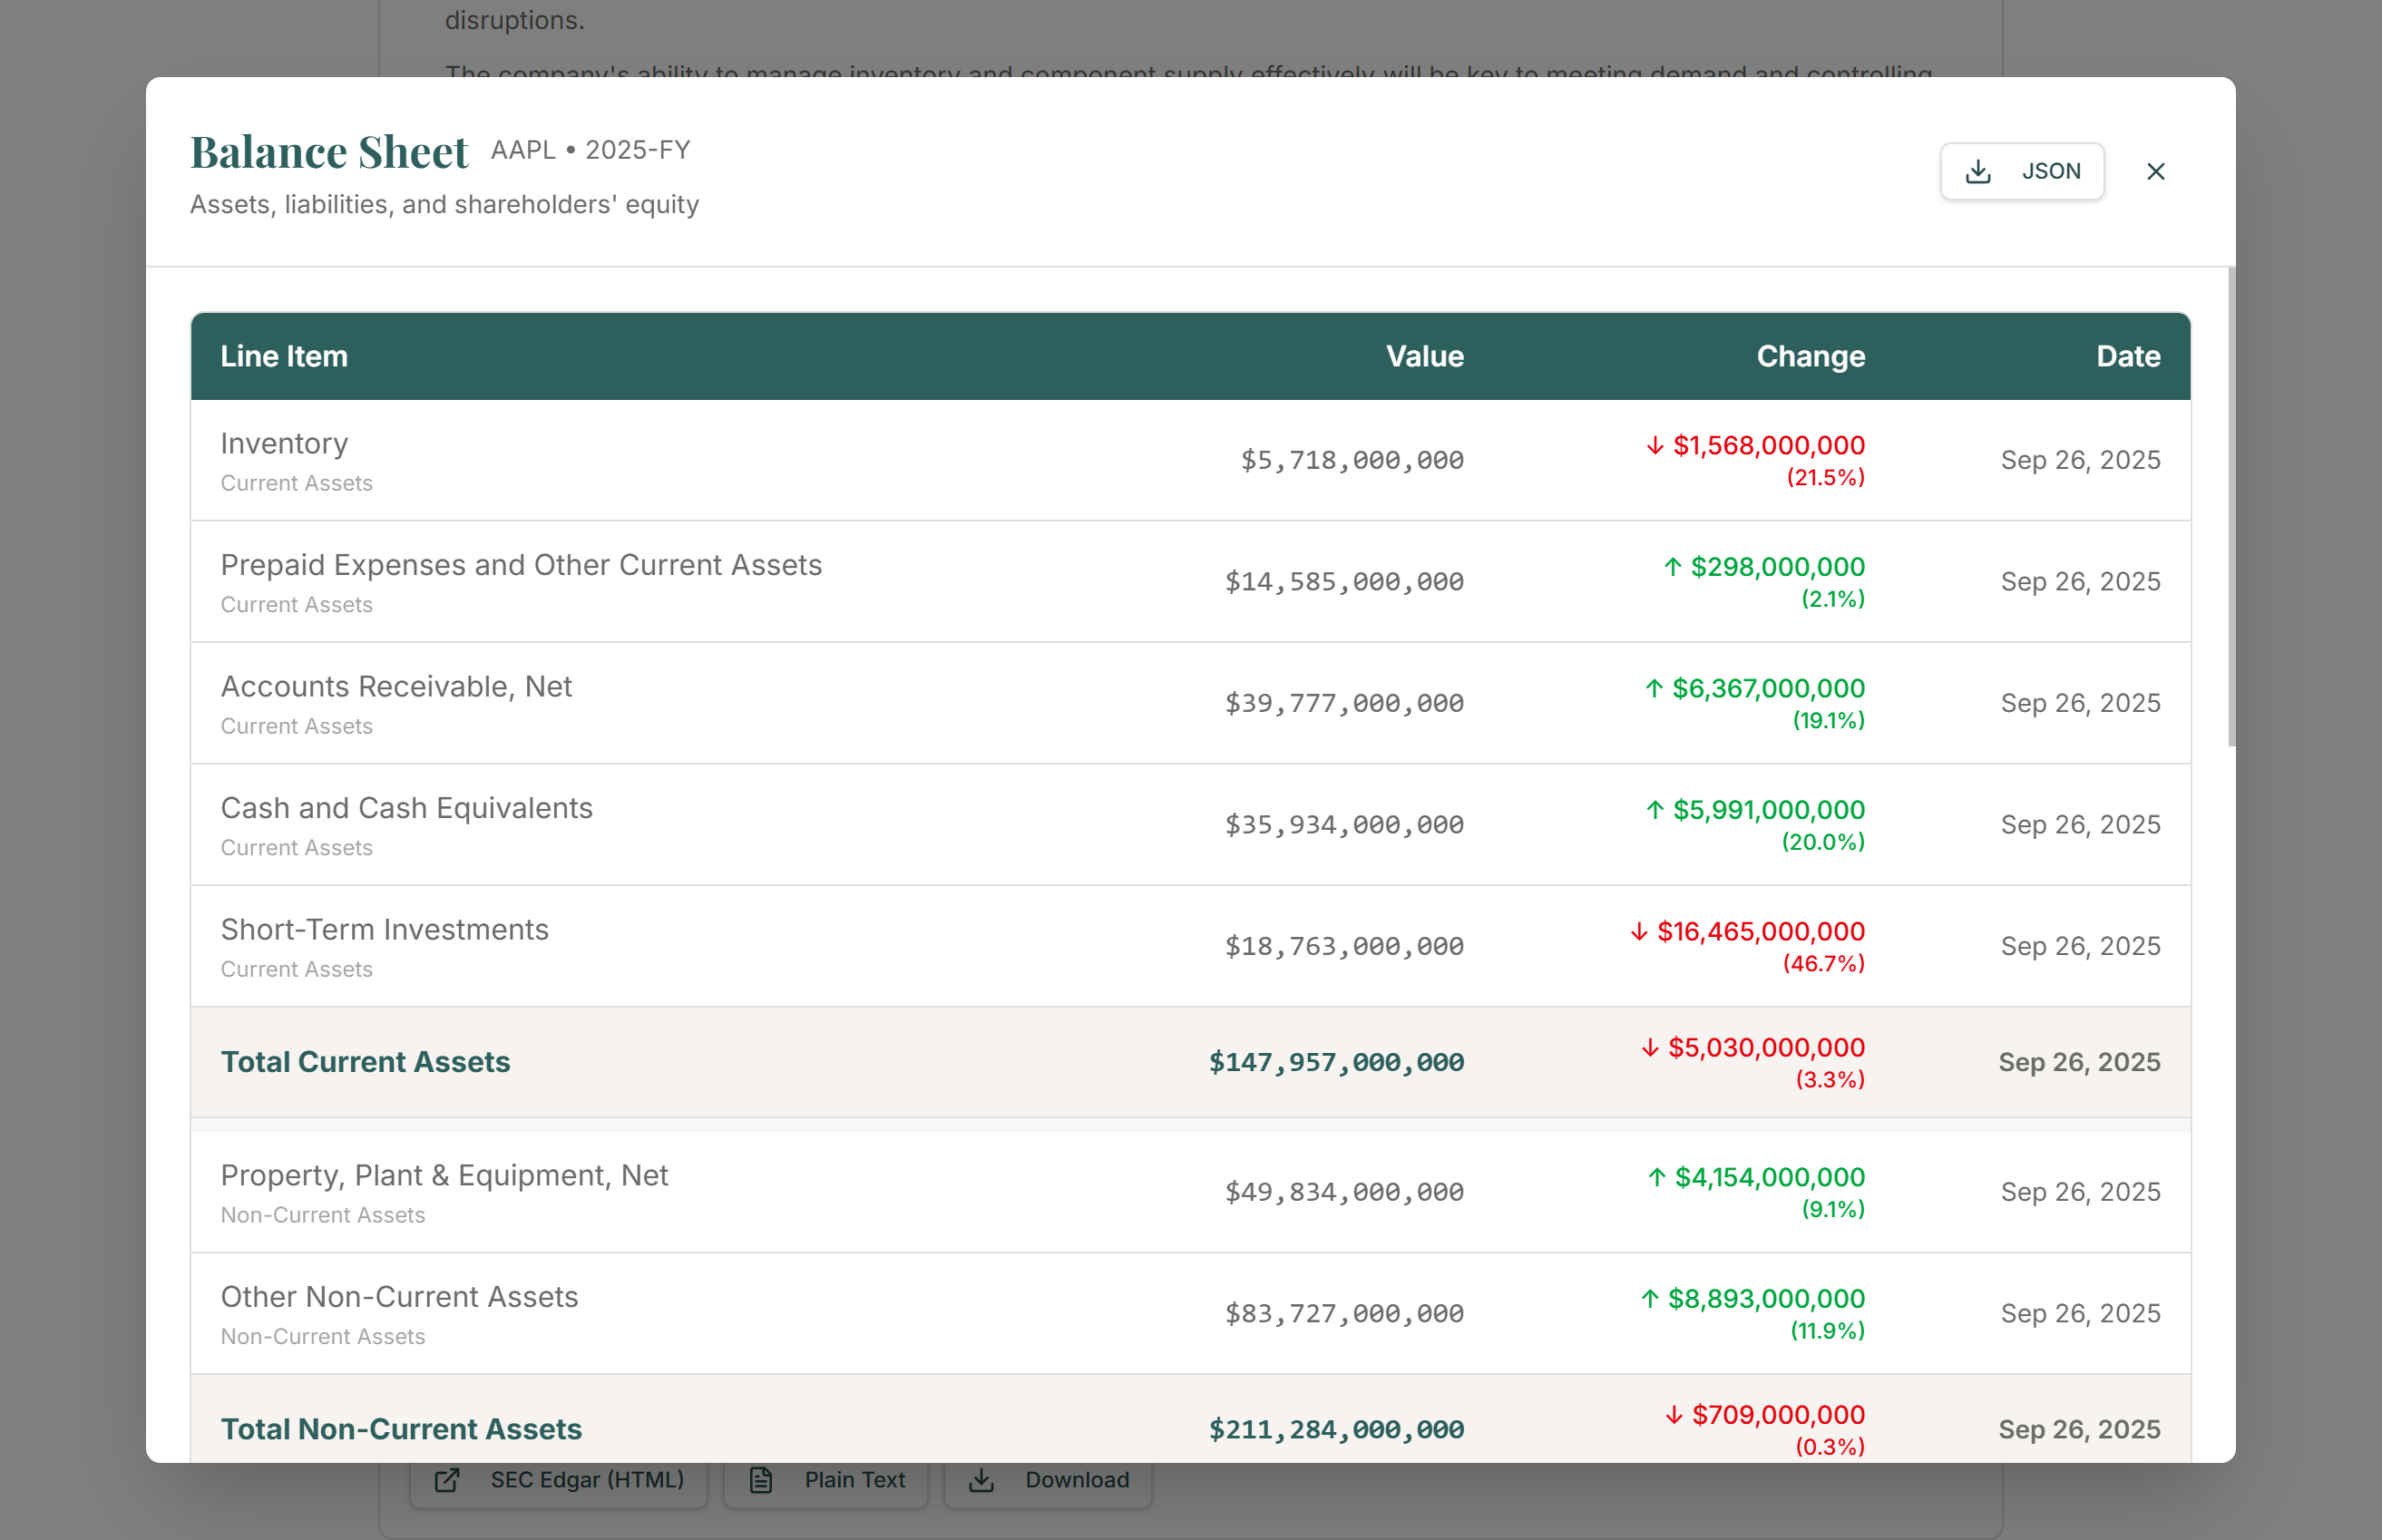
Raw financial data buried in SEC filings (left) vs. clean, standardized, and comparable statements Valufact produces (right).
Raw SEC Data
Valufact Standardized
The Multi-Stage Processing Pipeline
This isn’t a ChatGPT wrapper. Every filing goes through a purpose-built 6-stage pipeline:
- Detection — Continuous SEC RSS monitoring every 10 minutes with trading calendar awareness
- Download — Rate-limited retrieval from EDGAR with distributed locking to respect SEC access limits
- Cleaning — A 6-phase document transformation: XBRL truncation, header extraction & section marking, table extraction to CSV, HTML cleaning, section detection, and normalization
- Token Counting — Precise token measurement via API to determine optimal processing strategy
- AI Analysis — Filing-type-specific prompt architectures with structured JSON schemas, multi-chunk synthesis for large filings, and strict handling of missing data to eliminate hallucinations
- Storage & Delivery — Analysis is pre-computed and stored so users get instant results with zero loading delay
Financial Data Standardization
Valufact’s 4-layer concept classification engine maps every one of 17,738 GAAP concepts to a standardized financial statement structure:
- Manual Overrides (100% confidence) — Hand-crafted mappings for edge cases
- FASB Presentation Linkbase (100% confidence) — Official accounting standards board guidelines
- FASB Schema Matches (95% confidence) — Validated elements from FASB schema definitions
- Heuristic Rules (70% confidence) — Pattern-based classification for remaining concepts
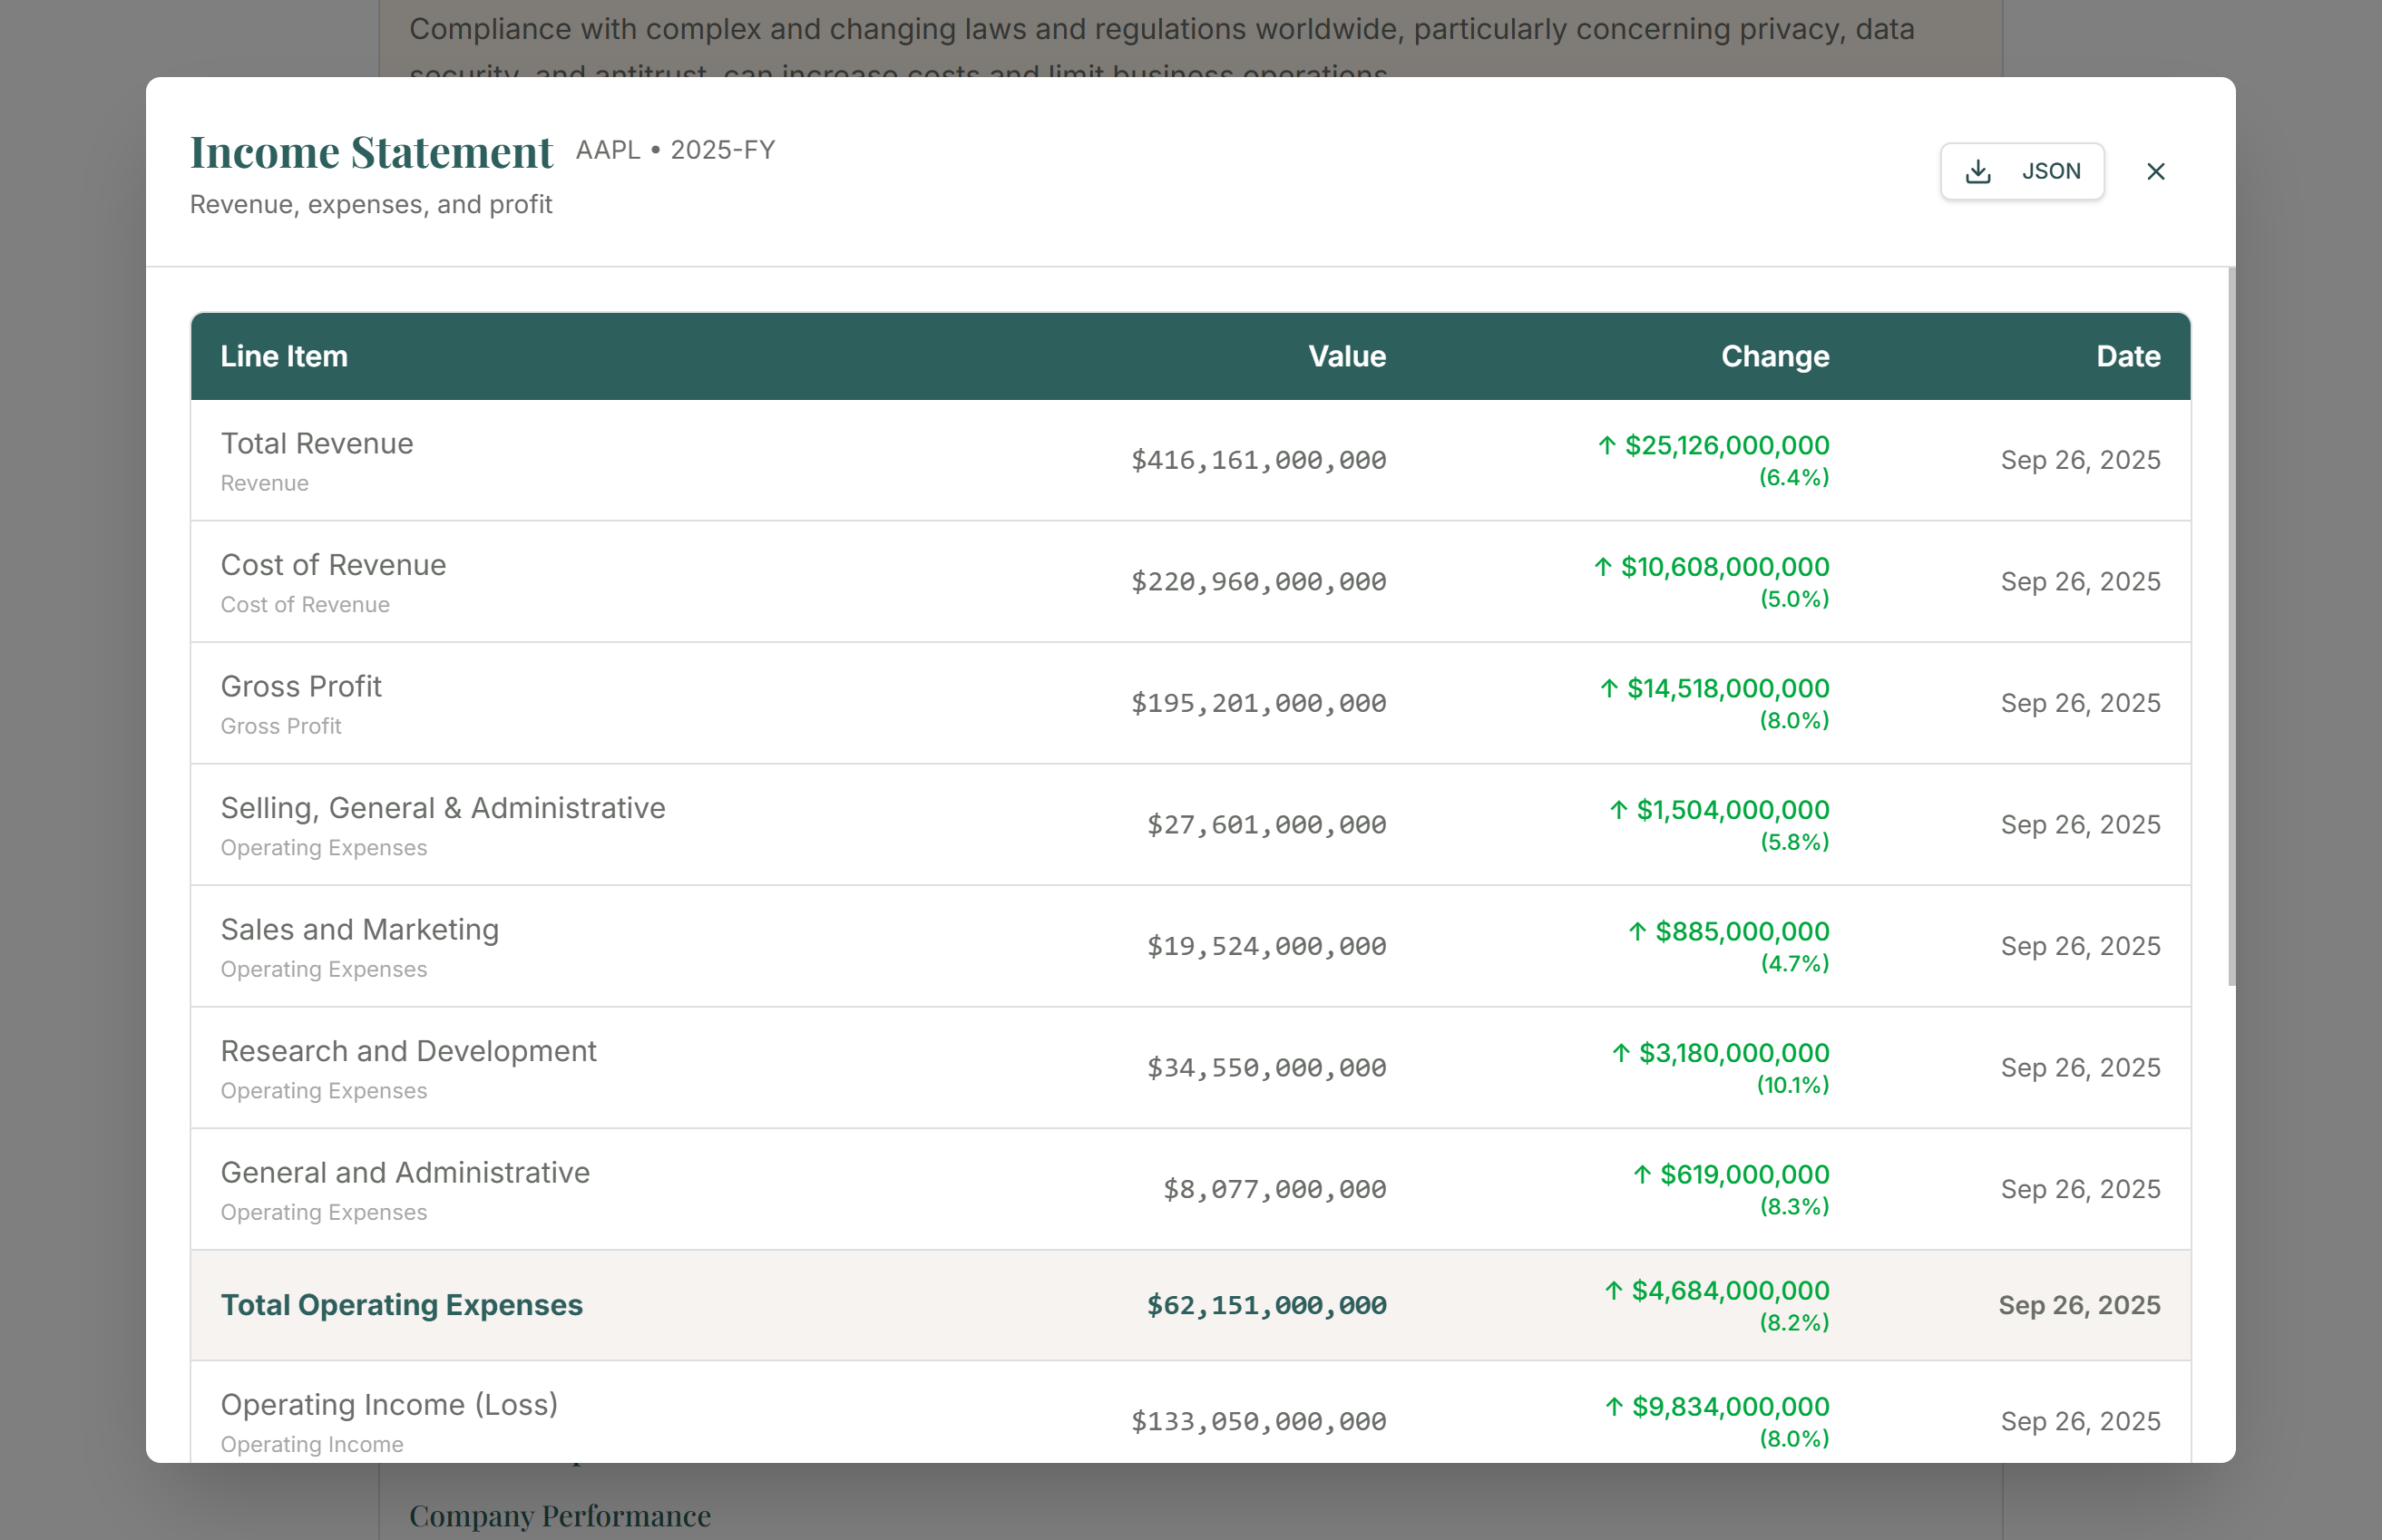
The result: every company’s financials are presented in an identical, comparable format — Balance Sheet, Income Statement, Cash Flow, and Statement of Stockholders’ Equity.
Financial Ratios & Metrics
Valufact automatically calculates 18 key financial ratios across five categories:
- Profitability — ROA, ROE, Net Profit Margin, Gross Profit Margin, Operating Margin
- Liquidity — Current Ratio, Quick Ratio, Cash Ratio
- Leverage — Debt-to-Equity, Debt-to-Assets, Equity Ratio, Interest Coverage
- Cash Flow — Operating Cash Flow Ratio, Free Cash Flow, Free Cash Flow Ratio
- Efficiency — Asset Turnover, Inventory Turnover, Receivables Turnover
Each ratio includes historical trend visualization, period-over-period comparisons, and plain-English explanations of what the numbers mean.
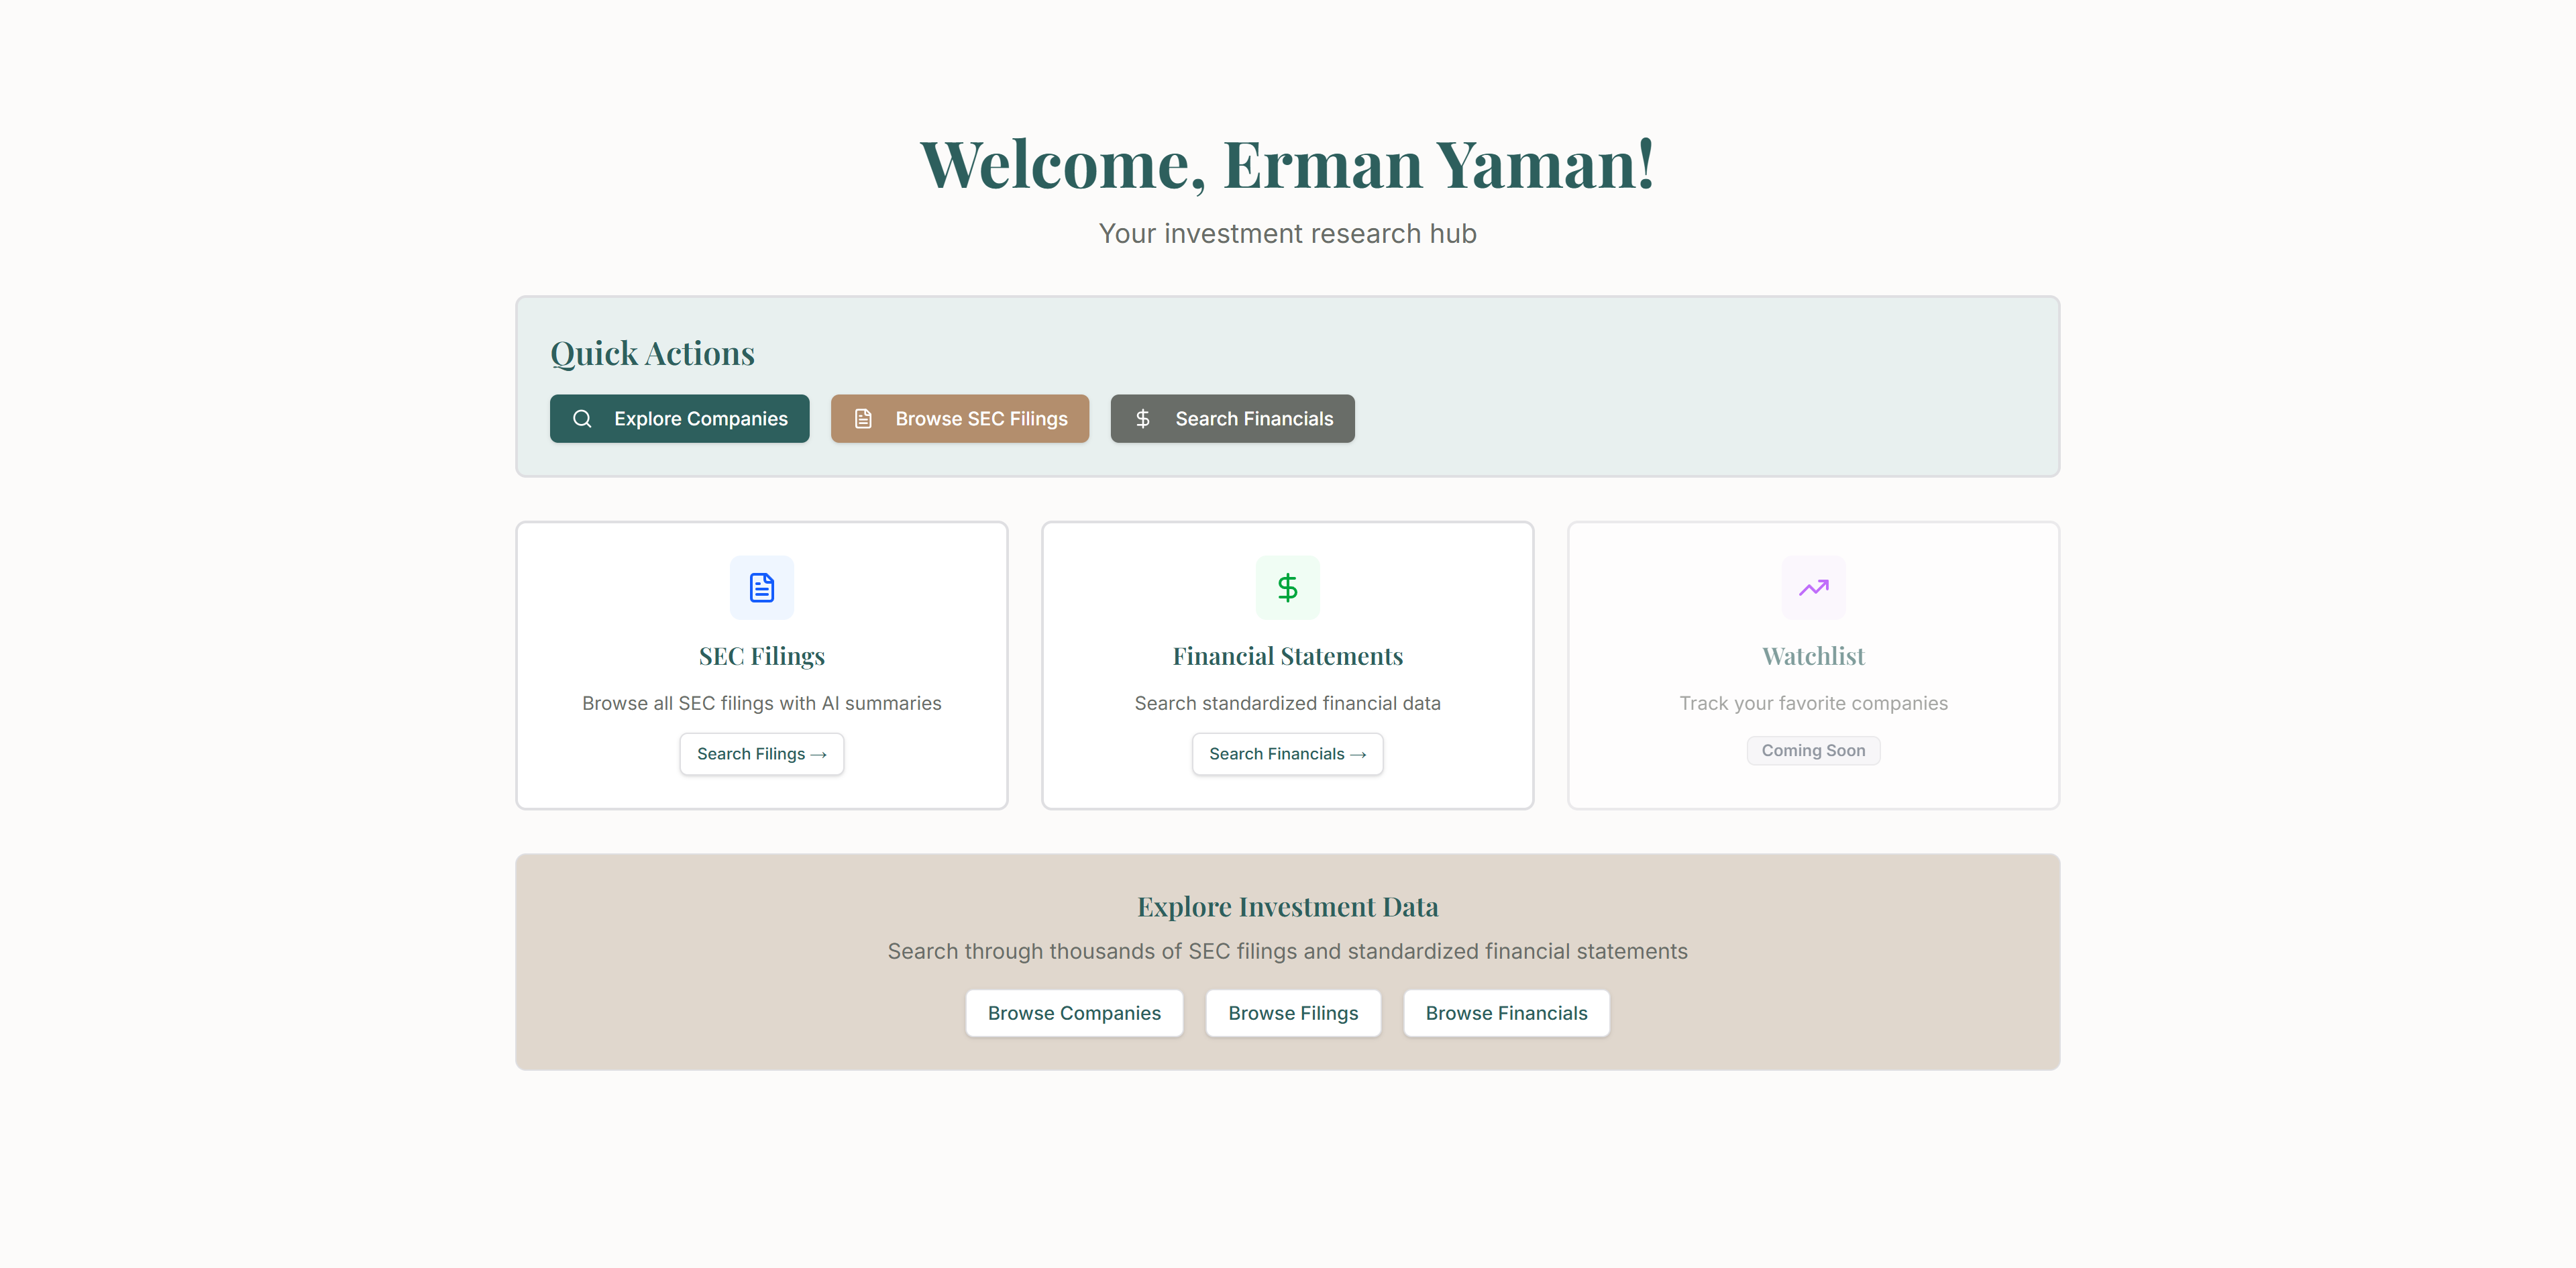
Company Profiles & Explore
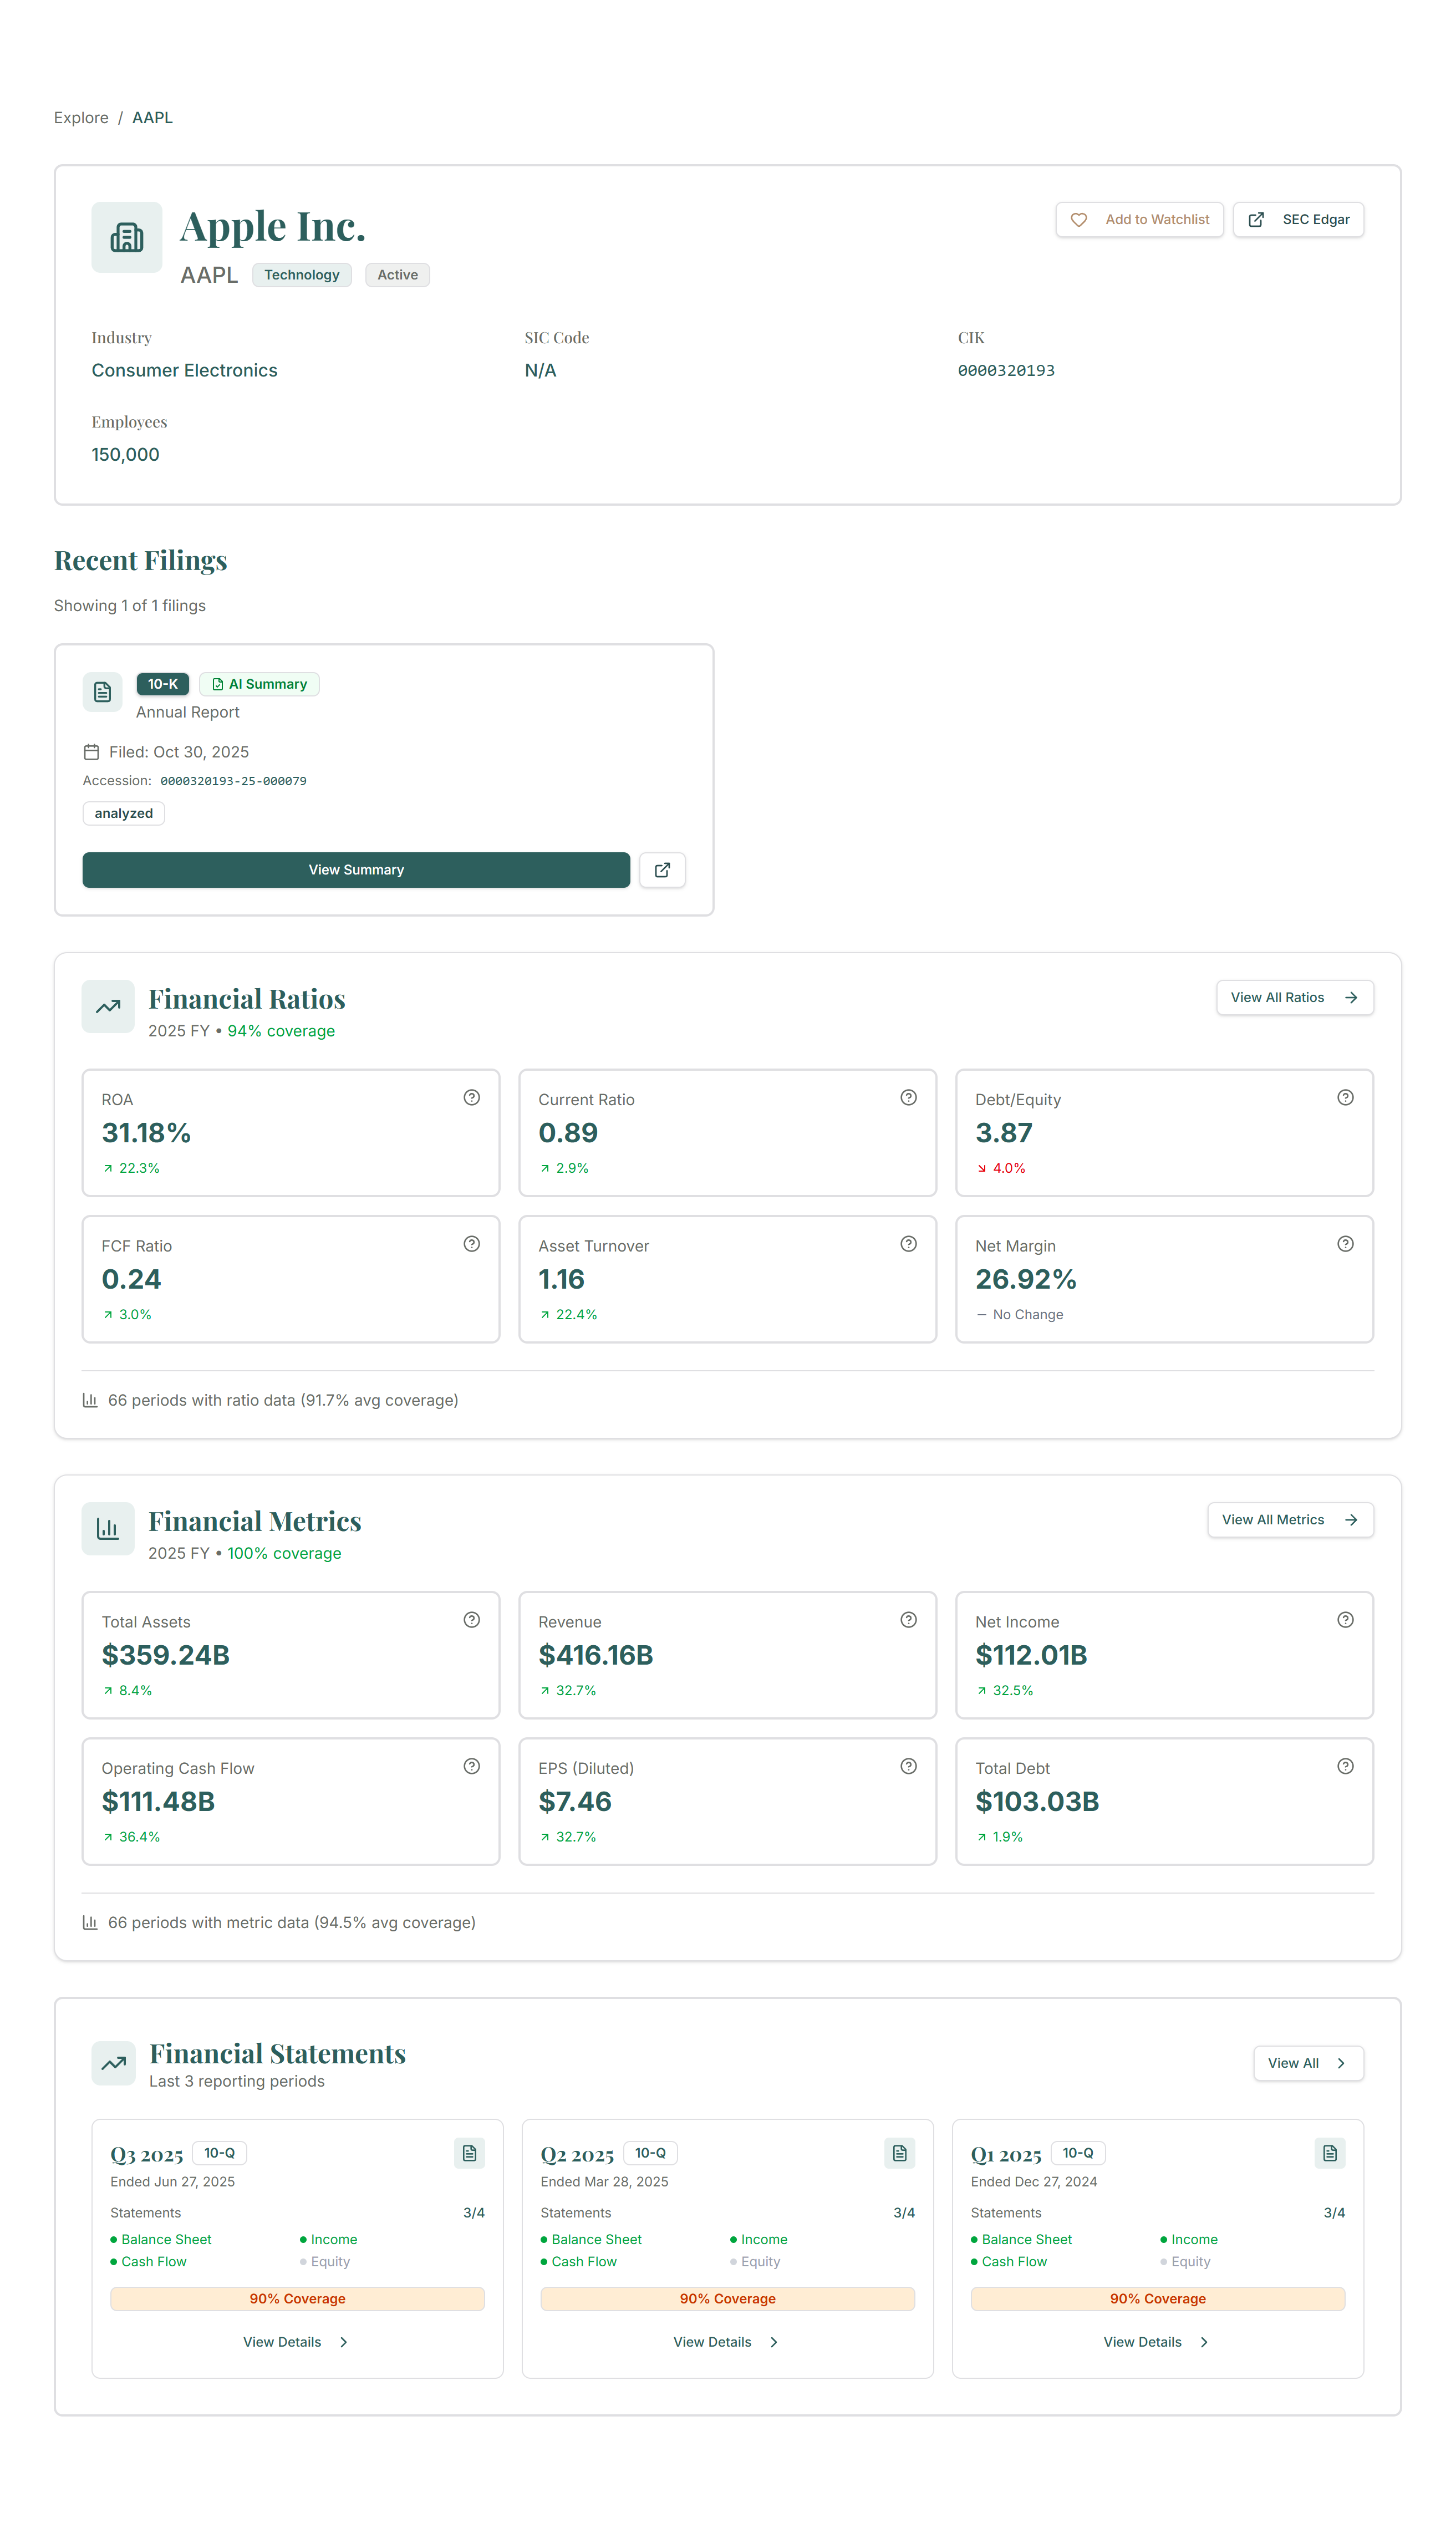
Users can browse and search across 11,000+ companies, filter by sector or industry, and access dedicated company hubs showing recent filings with AI summaries, standardized financial statements, ratio dashboards, and key metrics with trend charts.
What Makes Valufact Different
- Not a ChatGPT wrapper — Purpose-built infrastructure with a 6-phase cleaning pipeline, filing-type-specific prompts, rigid output schemas, and multi-stage chunk synthesis
- Direct from the source — Every piece of data pulled directly from the SEC’s EDGAR system — no third-party aggregator
- Transparency by design — Every summary links to the original filing; every financial statement shows a coverage score
- Built for both audiences — ELI5 summaries for regular investors, standardized multi-period financials for professionals
By the Numbers
- 11,083 companies with standardized financial data
- 66,000+ fiscal periods processed (~6 years of history per company)
- 17,738 concept mappings in the classification engine
- 87–95% average coverage of reported financial metrics per company
- 18 financial ratios calculated automatically with trend analysis
- 6 filing types supported with type-specific AI analysis (10-K, 10-Q, 8-K, Form 4, 20-F, 6-K)
Appendix: Full 10-K Analysis Example
A complete end-to-end AI-generated analysis of a 10-K annual report — Key Takeaway, ELI5, TL;DR, Analyst Summary, Opportunities & Risks, Potential Implications, and full Filing Breakdown — as it appears to users on Valufact.